Bitcoin Slides Below $67,000 Overnight as Another $400 Million in Bets Are Wiped Out
Bitcoin briefly fell below $67,000 overnight on November 14 and ether below $1,900, as more than $400 million in leveraged bets were liquidated.
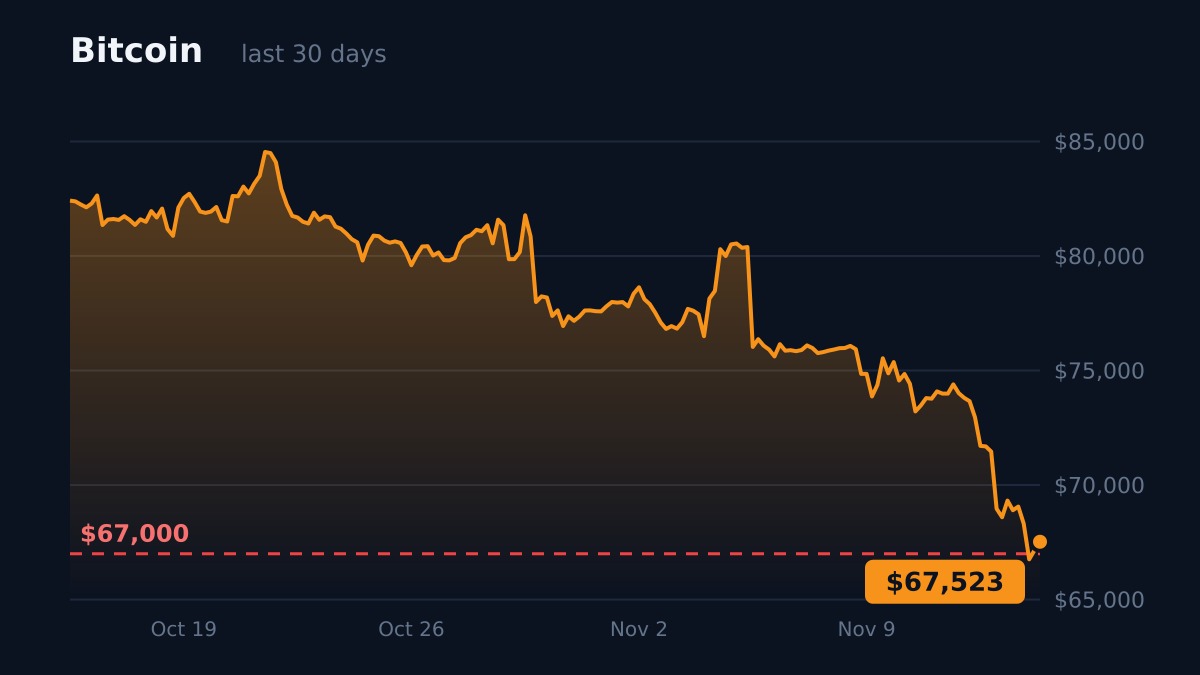
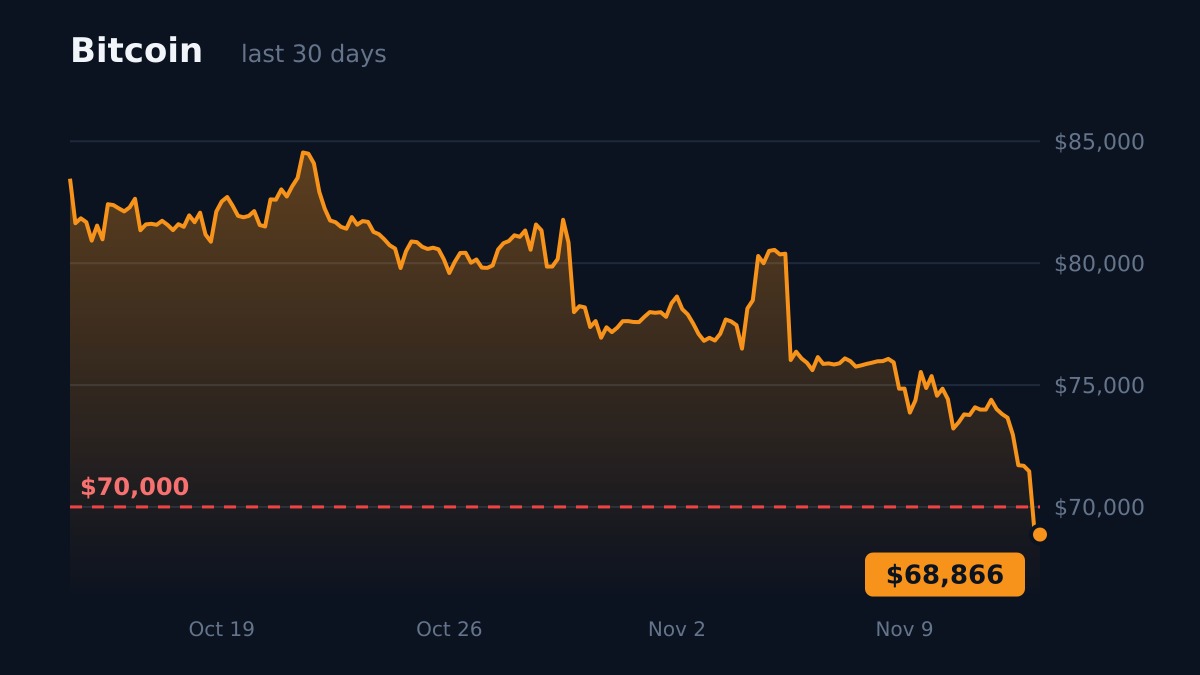
Bitcoin briefly fell below $67,000 overnight on November 14, extending the slide that took it under $70,000 a day earlier. Ether dropped below $1,900. More than $400 million in leveraged bets were liquidated during the night.
By 09:50 UTC bitcoin traded near $67,500, down about 2% in 24 hours. The crypto market has lost about $700 billion in value since early October.
Why it matters
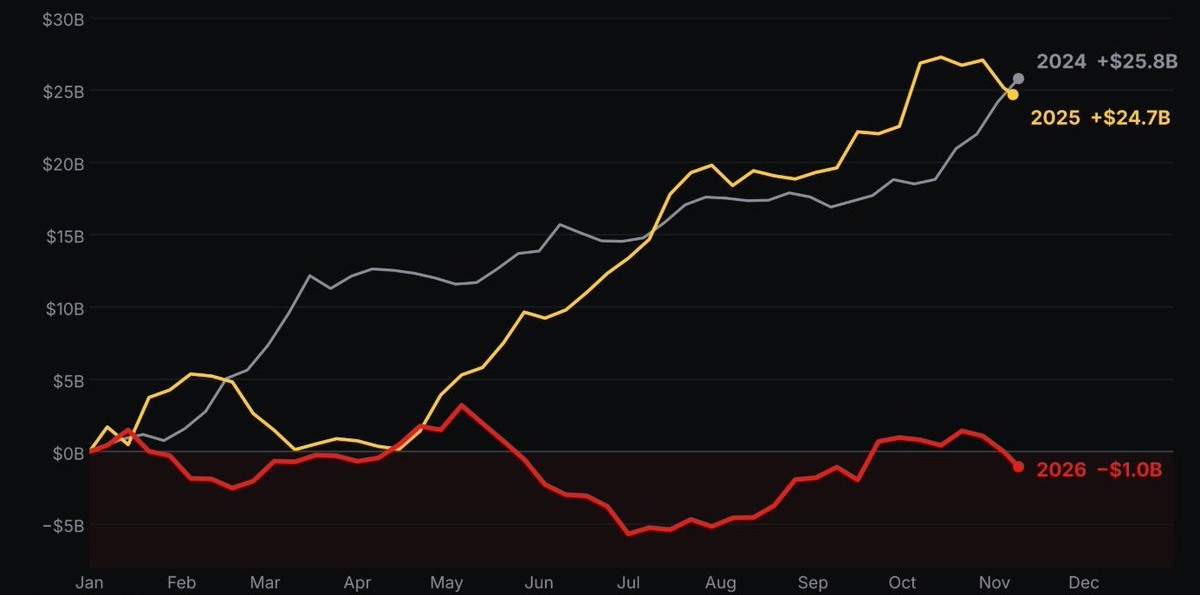
The drop is starting to hurt ordinary investors, not just traders. After a 7% fall in two days, the average buyer of a US spot bitcoin ETF is about 18% in the red. These funds have now seen three straight weeks of withdrawals, about $2.4 billion in total.
Bitcoin is also trading below its 200-week moving average for the first time since August. Since 2014 it has closed a week below that line less than one week in ten. The Fear & Greed Index fell to 13, deep in "extreme fear".
Why it's falling
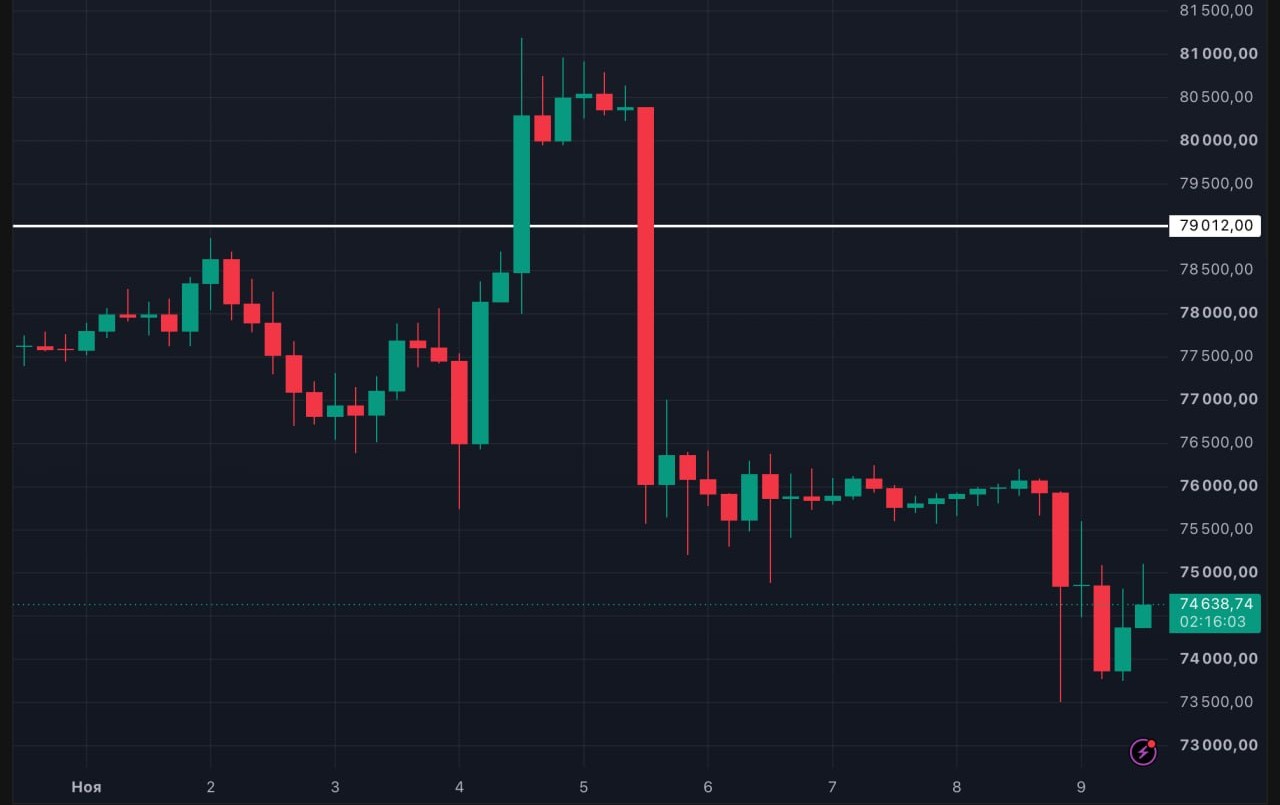
Coinbase Institutional says the main reason is the Federal Reserve, not the Binance hack. Hot October jobs and inflation data made markets fully price in a rate rise in December. Higher rates make risky assets like crypto less attractive. Coinbase had warned that losing $73,000 opened the way to a $66,000–68,000 support zone. Bitcoin is now inside it.
Leverage is draining out of the market. Open interest, the total value of bitcoin futures bets, fell to about $8.3 billion on Binance, the lowest since August 18. Funding rates turned negative, meaning more traders now pay to bet on a fall than on a rise.
A liquidation happens when an exchange closes a borrowed position by force because its losses have eaten the trader's deposit. Fewer such positions left means fewer forced sellers below the price.
What's next
Analysts at Bitfinex note that demand for bitcoin is still negative but has stopped falling. They point to $75,400, the average price paid by recent buyers, as the level where many of them may sell to break even.
- #bitcoin
- #price
- #liquidations
- #etf
Track it live
Indicators behind this story, updated daily.
- Bitcoin Funding RatesLive BTC and ETH perpetual funding rates and open interest across major exchanges, funding history since 2020, and what Bitcoin did after funding was negative, normal or overheated.1.1%BTC funding · Low
- Crypto Fear & Greed IndexToday's Crypto Fear & Greed Index with history since 2018, plus what Bitcoin actually did over the following 30 and 90 days after each zone.13Extreme Fear
- Altcoin Season IndexIs it altcoin season? The share of the top 50 altcoins that outperformed Bitcoin over the last 90 days, updated daily, with history and the full coin table.50Neutral
- Bitcoin technical analysisTrend, RSI, moving averages, support and resistance for BTC, updated daily.