Bitcoin Dips to $61,000, Close to Its $62,000 Mining Cost
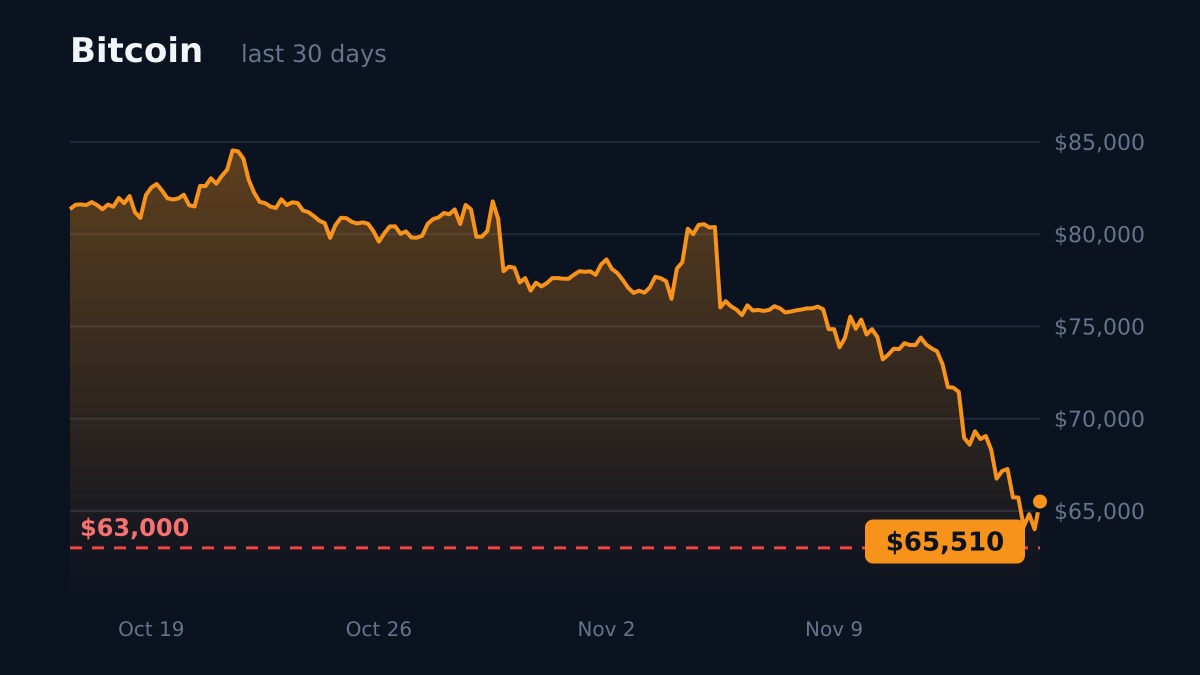
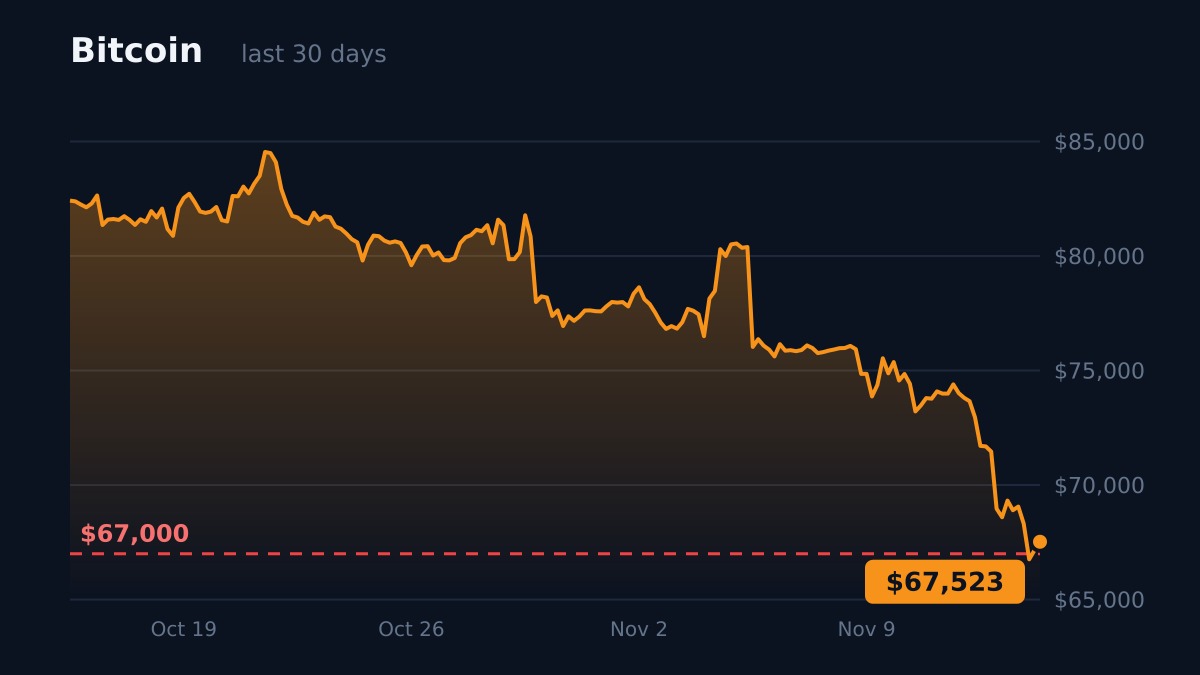
Bitcoin briefly fell to $61,000 and now trades near $63,400, close to the $62,000 average mining cost CryptoQuant's CEO cites; Fear & Greed sits at 10.
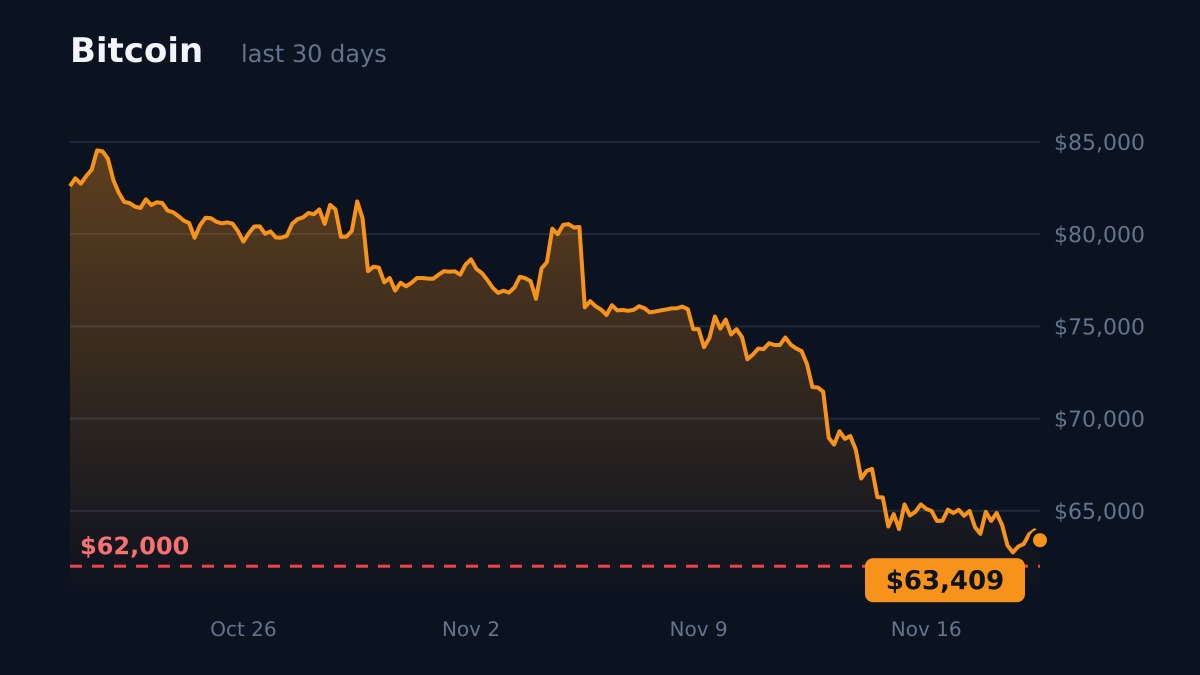
Bitcoin fell as low as $61,000 this week, its second drop toward $62,000 in five days. On November 19 it trades near $63,400. That is close to the roughly $62,000 it now costs to mine one bitcoin, according to the CEO of data firm CryptoQuant.
Why it matters
When the price falls below what it costs to mine a coin, miners lose money on every block. Public mining companies then come under pressure, and some sell coins to cover costs. He says a break below $62,000 could squeeze listed miners and the funds that invest in them.
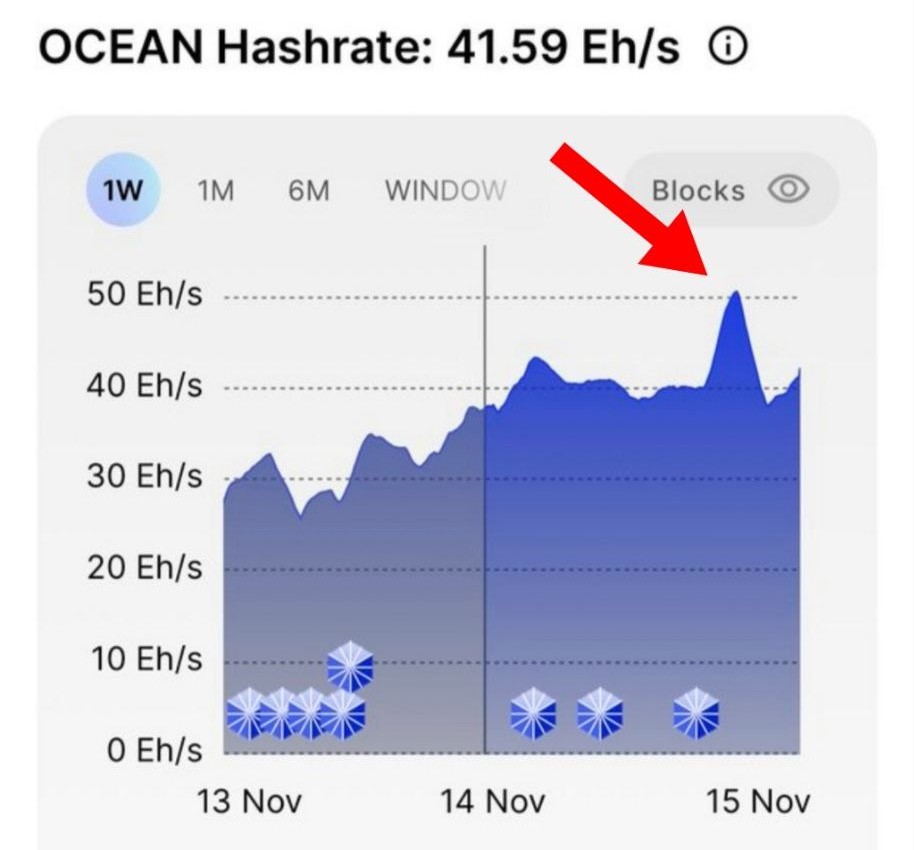
He also notes that the network's computing power stays high. In his view, that means miners still expect prices to recover over the long run. You can follow our own estimate on the bitcoin mining cost page.
How deep is the fear
The Fear & Greed Index is back at 10, which means extreme fear. CryptoQuant's Bull Score, which rates market strength from 0 to 100, fell to 10 as well. Its analysts say this is a zone where bottoms usually form, but they see no conditions for a fast turnaround.
Holders who bought in the last six months are now selling at a loss, data firm Glassnode says. Across the market, losses locked in by sellers over the past seven days reached about $8.6 billion. The peak this year was $9.8 billion, in June.
Context
Bitcoin is about 45% below its all-time high. The bear markets of 2018 and 2022 ended only after drops of 84% and 77%. Last week bitcoin fell to a three-month low below $63,000.
- #bitcoin
- #price
- #mining
- #market
Track it live
Indicators behind this story, updated daily.
- Bitcoin Mining CostLive estimate of the electricity cost to mine one bitcoin, compared with the BTC price. Adjust miner efficiency and power price to see your own break-even.$57,240per BTC
- Bitcoin Hash RibbonsAre Bitcoin miners capitulating? Live Hash Ribbons from the 30- and 60-day hashrate averages, every buy signal since 2011, and how they compare with buying on a random day.No capitulation84 days
- Crypto Fear & Greed IndexToday's Crypto Fear & Greed Index with history since 2018, plus what Bitcoin actually did over the following 30 and 90 days after each zone.10Extreme Fear
- Bitcoin technical analysisTrend, RSI, moving averages, support and resistance for BTC, updated daily.