Key Developments
- The S&P 500 has gone 106 days since a 3%+ pullback from all-time highs.
- This is the longest streak since 2018 and the seventh longest on record.
- Historically, after day 106 in such streaks, the average maximum drawdown over the next 12 months was 10%, while the average forward return was 5.6%.
Historical Context
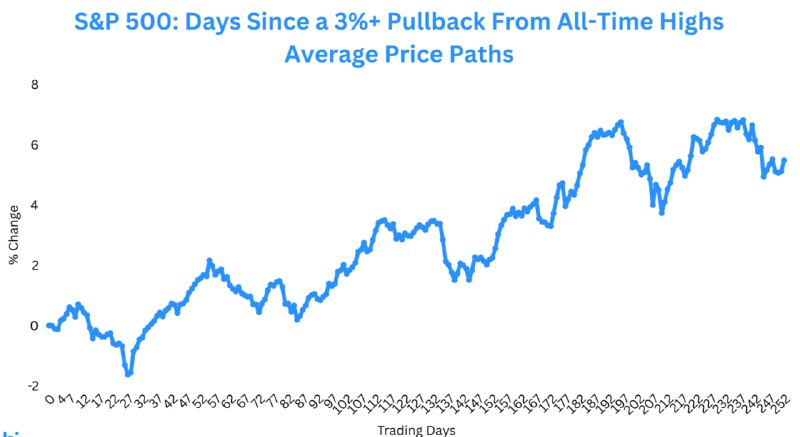
A review of past market cycles shows that extended periods without a significant pullback can be followed by mixed outcomes: future volatility alongside positive average returns. A referenced chart of average price paths following a 3%+ pullback indicates a generally upward trend peaking around +6%, punctuated by swings that reflect typical market variability.
These historical patterns do not guarantee future performance but offer a benchmark for risk and return expectations after prolonged stability in major indices.
Market Impact
- For equity investors, the data points to a balanced outlook: while the next year has historically delivered an average return of 5.6%, it has also included an average peak-to-trough decline of 10%.
- For crypto markets, which often trade in tandem with broader risk sentiment, an extended calm in equities can support risk appetite, but the historical drawdown statistic underscores the potential for volatility to return.
Conclusion
The S&P 500’s 106-day stretch without a 3% pullback from all-time highs underscores resilient market conditions not seen since 2018. History suggests a measured path forward—moderate average gains accompanied by the possibility of notable drawdowns—guiding risk management across both equities and digital assets.