Lead
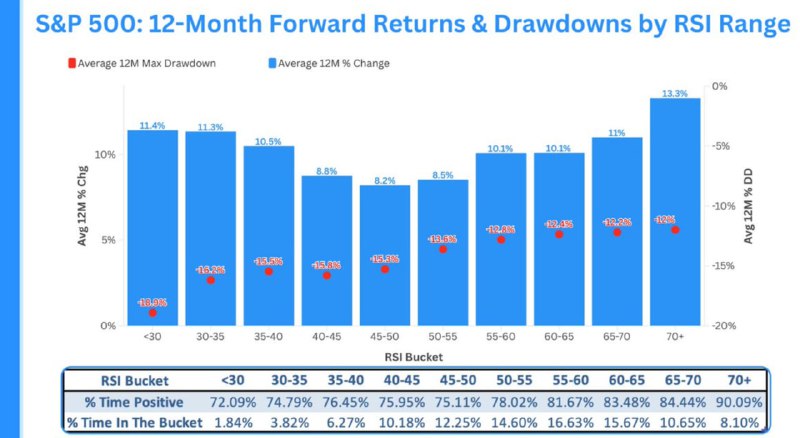
A fresh look at historical market data challenges the conventional fear of “overbought” readings in the Relative Strength Index (RSI). When the S&P 500’s RSI rises above 70, the market has historically delivered the highest 12‑month forward returns (13.3%) alongside lower average drawdowns, suggesting strong momentum can persist. The findings offer timely insights for crypto traders who widely rely on RSI in technical analysis.
The term “overbought” may need to be rethought.
Key Findings
- Top returns at high RSI: Average 12‑month performance peaks at 13.3% when RSI is 70+.
- Weakest returns at low-mid RSI: The lowest average 12‑month gain is 2.6% in the 30–35 RSI bucket.
- Drawdowns are smallest in higher RSI zones: Average 12‑month maximum drawdown is least severe at -8.9% for RSI 65–70, and around 12% when RSI exceeds 70, versus a much deeper -18.8% when RSI is near 30.
- Odds of gains: The share of positive 12‑month outcomes ranges from 72.09% (RSI <30) to 80.70% (RSI 50–55).
- Where markets spend time: The S&P 500 spends the most time in the RSI 40–45 range (18.35% of observations) and the least in RSI <30 (1.84%).
Why It Matters for Crypto
- RSI is ubiquitous in crypto trading. These results suggest RSI >70 need not be an automatic sell signal; it can indicate robust momentum with historically favorable forward returns in a major risk asset benchmark.
- Momentum can persist. Shorting solely on an “overbought” flag may be risky. Traders could consider trend context, breadth, and liquidity alongside RSI.
- Risk management implications. Historically smaller drawdowns in higher RSI zones challenge the idea that overbought conditions are inherently fragile.
Market Context
RSI is a popular oscillator used across equities and digital assets to gauge price momentum on a 0–100 scale. Readings above 70 are traditionally labeled “overbought,” yet historical S&P 500 behavior indicates that strength begets strength more often than it triggers immediate reversals. While crypto markets are more volatile than equities, the data underscores a key principle: momentum signals can remain elevated and productive longer than expected.
Conclusion
Historical evidence shows that elevated RSI readings often align with stronger forward returns and milder drawdowns, challenging the automatic bearish interpretation of “overbought.” For crypto market participants, the takeaway is clear: treat RSI in context—as a momentum gauge rather than a standalone reversal trigger.