Global liquidity expanded sharply in 2025, with global broad money rising to $142 trillion by September and developed economies reaching $74.3 trillion in Q3. The global broad money-to-GDP ratio stood at 121% in Q3 2025, but levels vary widely across major economies, with East Asia posting the highest ratios and several emerging markets among the lowest. A nearly 10% decline in the US dollar this year amplified the headline growth.
Key Developments
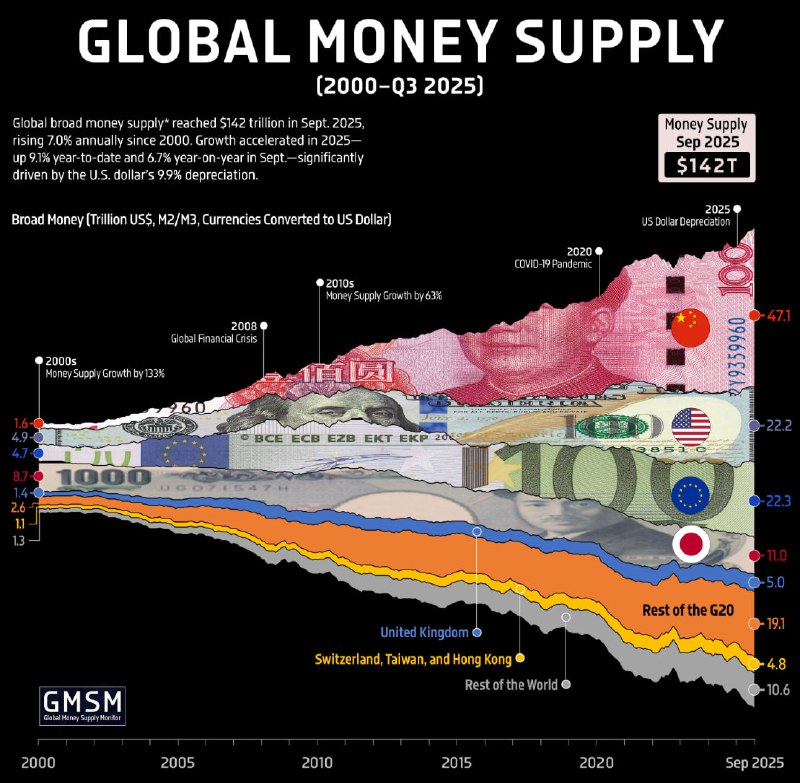
- Global broad money rose to $142T in September 2025 (from $26T in 2000), a 7.0% CAGR since 2000.
- Growth accelerated in 2025: +9.1% year-to-date and +6.7% YoY in September, aided by a 9.9% weakening of the US dollar.
- In developed economies, broad money reached $74.3T in Q3 2025, tracking a 4.9% CAGR from 2000–2025 after a 25% jump between February 2020 and February 2022 that later reverted to trend.
- The global broad money-to-GDP ratio stood at 121% in Q3 2025, with pronounced cross-country differences.
Ratios Across Economies
Broad money-to-GDP ratios differ markedly among the world’s largest economies:
- Highest ratios (East Asia):
- Japan: 256%
- Taiwan: 247%
- China: 243%
- South Korea: 171%
- Moderate ratios (roughly 60–80%): United States, India, Mexico, Russia, Saudi Arabia, Poland
- Notable examples: United States ~79%; Euro area ~112%
- Lowest ratios: Argentina ~21%, Turkey ~39%
Some economies with high money-to-GDP ratios, particularly in East Asia, tend to experience lower inflation, while countries with low ratios such as Argentina and Turkey continue to face persistently high inflation.
Composition of Global Liquidity
A handful of economies account for the majority of global broad money:
- China: $47.1T (33.1%)
- European Union: $22.3T (15.7%)
- United States: $22.2T (15.6%)
- Japan: $11.0T (7.7%)
- United Kingdom: $5.0T (3.5%)
Together, these markets make up roughly three quarters of global liquidity.
Market Context and Outlook
The rebound to trend growth in developed markets after the pandemic-era surge, combined with a weaker US dollar, has lifted headline measures of global money supply in 2025. Divergent money-to-GDP ratios highlight structural differences across economies, with implications for inflation dynamics, monetary policy, and risk sentiment. For digital assets and broader markets, shifts in global liquidity and the US dollar’s trajectory remain key macro signals to watch into 2026.