Lead
Bitcoin’s 12‑month forward returns have historically been strongest when bought during high, “overbought” Relative Strength Index (RSI) readings, underscoring the asset’s momentum-driven behavior. The trade-off: drawdowns tend to be larger when RSI runs hot, highlighting the importance of risk management.
Key Developments
- A recent momentum analysis compares Bitcoin’s behavior to that of the S&P 500, noting that trend persistence can drive outsized forward returns.
- The study emphasizes that momentum begets momentum, with robust average 12‑month gains when entries occur at elevated RSI levels, albeit with higher volatility.
- Drawdowns are noted to be larger above RSI 70, consistent with the “overbought” regime’s higher risk profile.
“Momentum feeds momentum,” the analysis concludes, noting that strong trends can continue even from overbought conditions.
Data Highlights by RSI Bucket
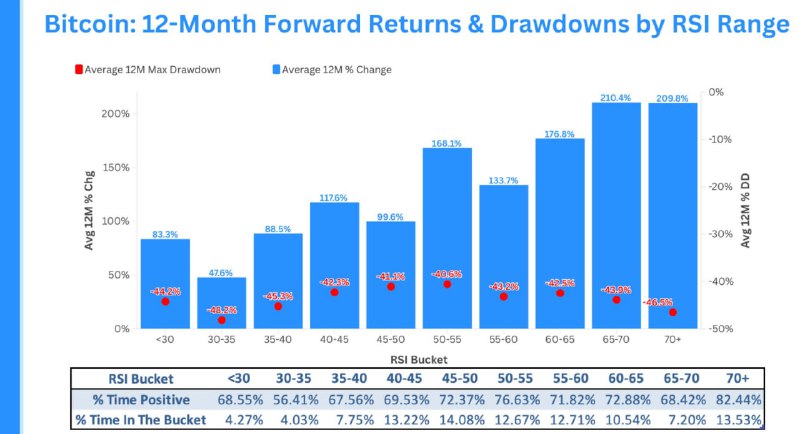
A bar chart of Bitcoin’s historical performance grouped by RSI ranges shows average 12‑month forward returns and maximum drawdowns. Select buckets include:
- RSI < 30 (oversold): Avg. 12‑month change +174.7%, Max drawdown -49.6%
- RSI 30–35: Avg. +83.8%, Max drawdown -47.5%
- RSI 35–40: Avg. +67.5%, Max drawdown -42.5%
- RSI 40–45: Avg. +44.5%, Max drawdown -35.0%
- RSI 45–50: Avg. +36.9%, Max drawdown -34.0%
These figures illustrate two key points:
- Bitcoin has delivered positive average 12‑month gains across multiple RSI regimes, reflecting its secular growth and trend strength.
- As RSI moves higher, forward returns can remain strong, but drawdowns become an integral part of the risk-return trade-off, especially in “overbought” zones.
What Is RSI and Why It Matters
The Relative Strength Index (RSI) is a momentum oscillator ranging from 0 to 100. Traditional thresholds mark >70 as overbought and <30 as oversold. While many traders view overbought readings as a reversal signal, trend-following research shows strong assets can stay overbought and continue to rise, particularly in momentum-driven markets like Bitcoin.
Market Impact and Strategy Takeaways
- For trend followers, entries during high RSI may still yield strong outcomes when paired with disciplined risk controls.
- Mean-reversion traders may prefer waiting for oversold or mid-range RSI, where volatility can be somewhat lower, though historical averages suggest Bitcoin’s returns have been strong across regimes.
- The data reinforces that volatility is a feature, not a bug in crypto markets, making position sizing and stop-loss policies crucial.
Conclusion
Bitcoin’s historical RSI profile underscores a momentum-centric market: strong trends can extend even from overbought levels, but with larger drawdowns. For investors and traders, the message is balanced—momentum can reward patience and trend-following, provided risk is managed for crypto’s characteristic volatility.