Lead
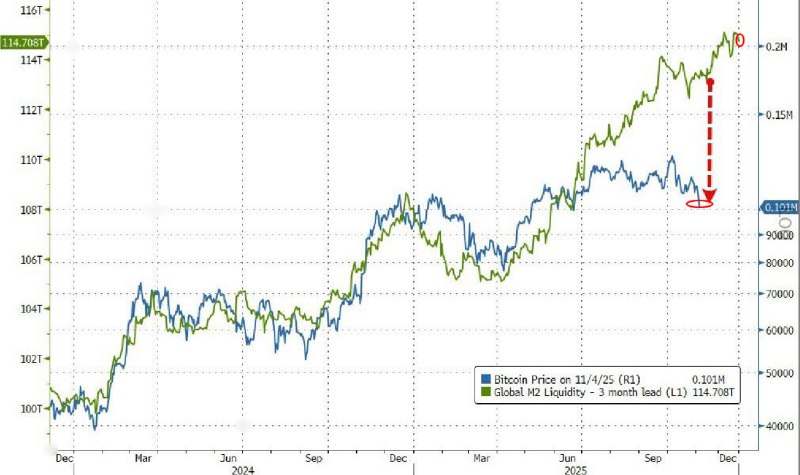
A fresh chart update comparing Bitcoin with global M2 liquidity highlights a renewed alignment between macro liquidity trends and BTC price action. The visualization shows Bitcoin around $114,708 on November 4, 2025, with global M2 liquidity marked at 0.101M (as labeled on the chart), reinforcing the view that liquidity expansions often precede crypto rallies.
Key Developments
- The chart overlays Bitcoin's price with global M2 liquidity, using a three-month lead for the liquidity series.
- As of November 4, 2025, Bitcoin is shown near $114,708, following an upward trajectory aligned with liquidity growth.
- Global M2 liquidity is annotated at 0.101M on the chart, with a visible correlation to BTC moves.
Why It Matters
Global M2 liquidity—broad money supply across major economies—has long been tracked as a macro driver for risk assets, including cryptocurrencies. The updated visualization suggests that when liquidity expands, Bitcoin tends to respond after a lag, consistent with prior cycles where easing financial conditions supported crypto market recoveries.
Market Context
- The three-month lead applied to the M2 series implies that liquidity changes may foreshadow subsequent Bitcoin price movements.
- The current alignment shows BTC advancing in tandem with an upswing in global liquidity, a pattern often cited by macro-focused crypto analysts.
- While the correlation is notable, it is not deterministic: policy shifts, regulatory developments, and market-specific events can introduce deviations.
Looking Ahead
If the observed relationship holds, continued strength in global liquidity could remain a supportive backdrop for Bitcoin. Market participants will watch upcoming macro data and central bank guidance to gauge whether the liquidity trend persists, potentially influencing BTC’s medium-term trajectory.