Lead
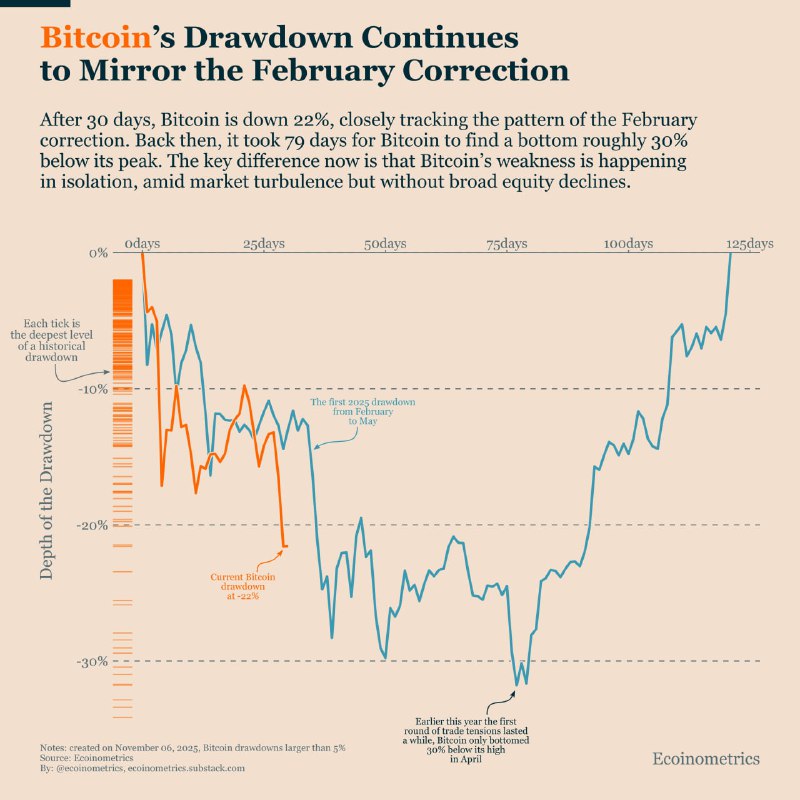
Bitcoin has fallen 22% from its recent peak over the past 30 days, with the price trajectory closely mirroring the market correction seen in February. In that earlier episode, the decline extended for 79 days and bottomed at roughly 30% below the high, drawing fresh comparisons among traders and analysts.
Key Developments
- Bitcoin is down 22% from its peak following a month-long pullback
- The current path closely resembles the February correction
- The February drawdown took 79 days to find a bottom, near -30% from the prior high
- Both episodes began after a round of trade tensions in the United States
- Comparative analysis references market datasets from CoinMetrics and economic series from the Federal Reserve Bank of St. Louis
Market Context
The overlay of the current drawdown with February’s pattern suggests a similar rhythm of selling pressure and intermittent rebounds. While historical analogs can be informative, they do not guarantee future outcomes. Market sentiment around macro headlines—including U.S. trade developments—has previously coincided with pivotal turns in risk assets, including cryptocurrencies.
What to Watch
- Whether selling pressure eases before the historical 79-day timeframe associated with February’s correction
- If the current drawdown stabilizes above the prior ~30% trough level or revisits similar depths
- Shifts in macro news and liquidity conditions that could alter the trajectory
Historical comparisons indicate a path, not a promise. The current -22% drawdown may continue to diverge or converge with February’s pattern as new information hits the market.
Conclusion
As Bitcoin’s pullback approaches the one-month mark, the resemblance to February’s correction is in focus. Traders will be watching whether the decline abates sooner than the prior 79-day cycle or extends toward a similar ~30% drawdown before finding a durable bottom.